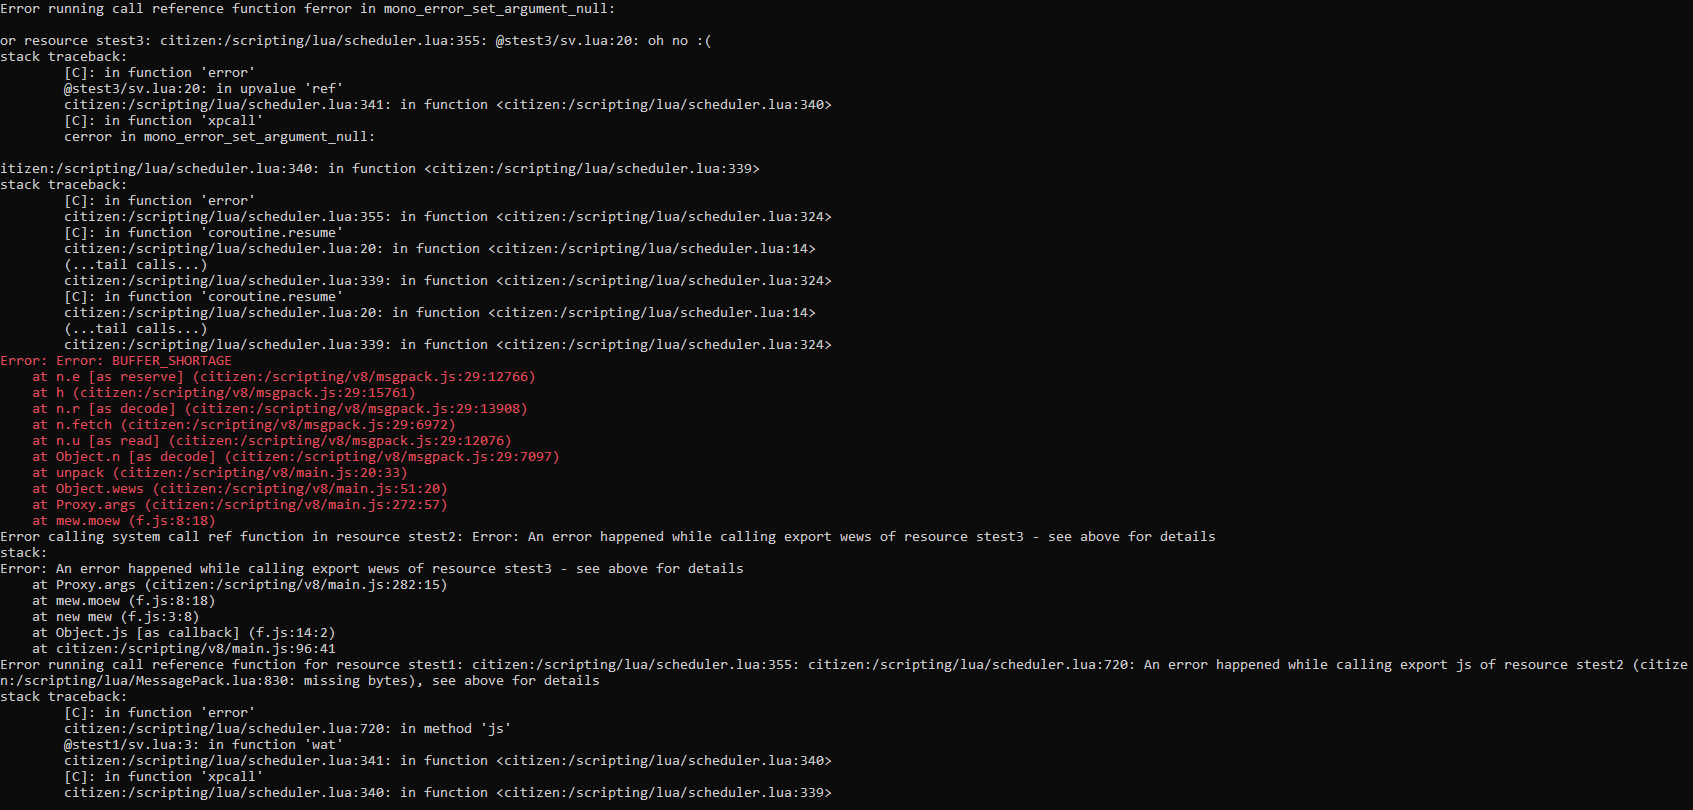
In the past, the Citizen framework scripting runtime would print really messy stack traces such as.. this:

This stack trace goes on for around 3-4 times the displayed length, and is generally.. a big mess. You can tell that some resource code is running, like @stest3/sv.lua:20, f.js:8 and @stest1/sv.lua, but everything else that is shown is just noise.
Starting at today’s Windows server (and client, on canary) releases, we’re doing something new and exciting: stack boundary stitching. This is the third attempt at implementing cross-runtime stack tracing, and the first one that actually had the possibility to make it out the door.
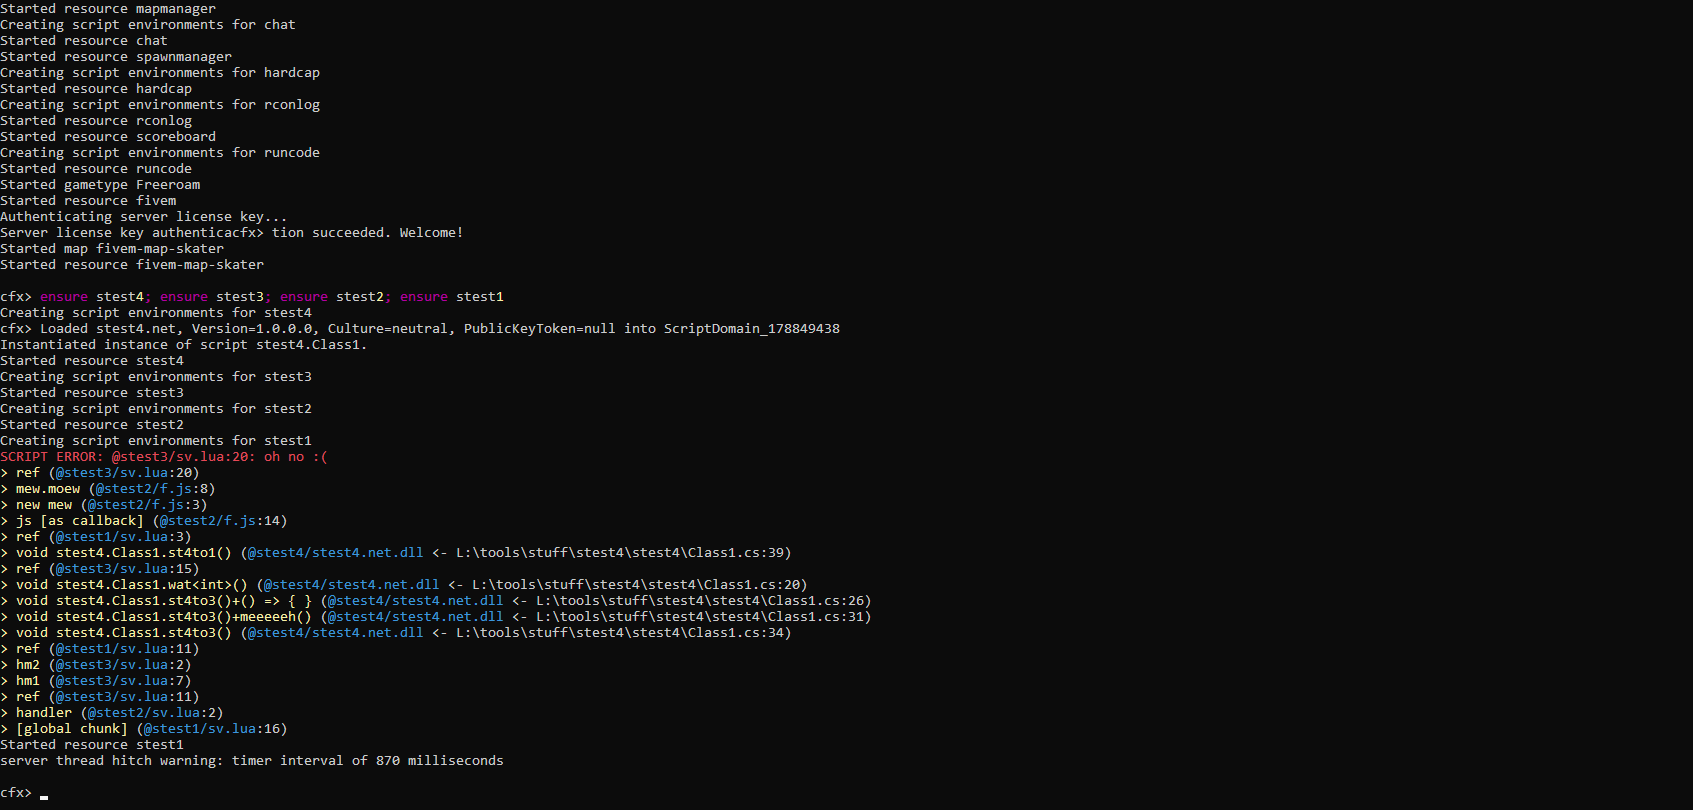
To compare, look at the new stack trace output:

You’ll see that we’re filtering out only user code, and we’re also showing each error only once: every error down the stack due to failed reference calls simply gets hidden. In addition to that, we now format C# functions using a ‘friendly’ library with support for providing nice method names.
An API and more functionality for stack traces (showing a call boundary, JS source map support) might be offered in the future – for now this is a feature which is generally runtime-internal, and is supported across runtimes: Mono/C#, V8/JS and Lua.
It’d also be really nice if you’d provide some more suggestions regarding developer experience improvements you’d love to see. We think this one will help a lot diagnosing script issues at a glance, however!